Methods for Determining Atomic Structures
Several methods are currently used to determine the structure of a protein, including X-ray crystallography, NMR spectroscopy, and electron microscopy. Each method has advantages and disadvantages. In each of these methods, the scientist uses many pieces of information to create the final atomic model. Primarily, the scientist has some kind of experimental data about the structure of the molecule. For X-ray crystallography, this is the X-ray diffraction pattern. For NMR spectroscopy, it is information on the local conformation and distance between atoms that are close to one another. In electron microscopy, it is an image of the overall shape of the molecule.
In most cases, this experimental information is not sufficient to build an atomic model from scratch. Additional knowledge about the molecular structure must be added. For instance, we often already know the sequence of amino acids in a protein, and we know the preferred geometry of atoms in a typical protein (for example, the bond lengths and bond angles). This information allows the scientist to build a model that is consistent with both the experimental data and the expected composition and geometry of the molecule.
When looking at PDB entries, it is always good to be a bit critical. Keep in mind that the structures in the PDB archive are determined using a balanced mixture of experimental observation and knowledge-based modeling. It often pays to take a little extra time to confirm for yourself that the experimental evidence for a particular structure supports the model as represented and the scientific conclusions based on the model.
X-ray Crystallography
Method Overview
Most of the structures included in the PDB archive were determined using X-ray crystallography. For this method, the protein is purified and crystallized, then subjected to an intense beam of X-rays. The proteins in the crystal diffract the X-ray beam into one or another characteristic pattern of spots, which are then analyzed (with some tricky methods to determine the phase of the X-ray wave in each spot) to determine the distribution of electrons in the protein. The resulting map of the electron density is then interpreted to determine the location of each atom. The PDB archive contains two types of data for crystal structures. The coordinate files include atomic positions for the final model of the structure, and the data files include the structure factors (the intensity and phase of the X-ray spots in the diffraction pattern) from the structure determination. You can create an image of the electron density map using tools like the Astex viewer, which is available through a link on the Structure Summary page.
X-ray crystallography can provide very detailed atomic information, showing every atom in a protein or nucleic acid along with atomic details of ligands, inhibitors, ions, and other molecules that are incorporated into the crystal. However, the process of crystallization is difficult and can impose limitations on the types of proteins that may be studied by this method. For example, X-ray crystallography is an excellent method for determining the structures of rigid proteins that form nice, ordered crystals. Flexible proteins, on the other hand, are far more difficult to study by this method because crystallography relies on having many, many molecules aligned in exactly the same orientation, like a repeated pattern in wallpaper. Flexible portions of protein will often be invisible in crystallographic electron density maps, since their electron density will be smeared over a large space. This is described in more detail on the page about missing coordinates.
Biological molecule crystals are finicky: some form perfect, well-ordered crystals and others form only poor crystals. The accuracy of the atomic structure that is determined depends on the quality of these crystals. In perfect crystals, we have far more confidence that the atomic structure correctly reflects the structure of the protein. Two important measures of the accuracy of a crystallographic structure are its resolution, which measures the amount of detail that may be seen in the experimental data, and the R-value, which measures how well the atomic model is supported by the experimental data found in the structure factor file.
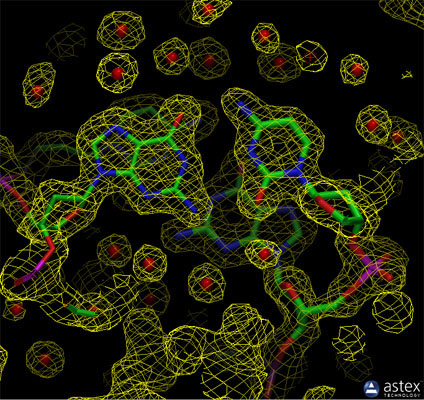
The experimental electron density from a structure of DNA is shown here (PDB entry 196d), along with the atomic model that was generated based on the data. The contours surround regions with high densities of electrons, which correspond to the atoms in the molecule.
As part of the biocuration process, the wwPDB generates Validation Reports that provide an assessment of structure quality using widely accepted standards and criteria. These Reports include an "executive” summary image of key quality indicators to help non-experts interpret these reports. For more information, visit wwpdb.org.
Exploring Biological Structure and Function using X-ray Free Electron Lasers (XFEL)
New technology, termed serial femtosecond crystallography, is revolutionizing the methods of X-ray crystallography. A free electron X-ray laser (XFEL) is used to create pulses of radiation that are extremely short (lasting only femtoseconds) and extremely bright. A stream of tiny crystals (nanometers to micrometers in size) is passed through the beam, and each X-ray pulse produces a diffraction pattern from a crystal, often burning it up in the process. A full data set is compiled from as many as tens of thousands of these individual diffraction patterns. The method is very powerful because it allows scientists to study molecular processes that occur over very short time scales, such as the absorption of light by biological chromophores.
Structures of photoactive yellow protein were determined by serial femtosecond crystallography after illumination, capturing the isomerization of the chromophore after it absorbs light. Structures included in this movie include: 5hd3 (ground state), 5hdc (100-400 femtoseconds after illumination), 5hdd (800-1200 femtoseconds), 5hds (3 picoseconds), 4b9o (100 picoseconds), 5hd5 (200 nanoseconds) and 1ts0 (1 millisecond). For more, see Molecule of the Month on Photoactive Yellow Protein.
NMR Spectroscopy
Method Overview
NMR spectroscopy may be used to determine the structure of proteins. The protein is purified, placed in a strong magnetic field, and then probed with radio waves. A distinctive set of observed resonances may be analyzed to give a list of atomic nuclei that are close to one another, and to characterize the local conformation of atoms that are bonded together. This list of restraints is then used to build a model of the protein that shows the location of each atom. The technique is currently limited to small or medium proteins, since large proteins present problems with overlapping peaks in the NMR spectra.
A major advantage of NMR spectroscopy is that it provides information on proteins in solution, as opposed to those locked in a crystal or bound to a microscope grid, and thus, NMR spectroscopy is the premier method for studying the atomic structures of flexible proteins. A typical NMR structure will include an ensemble of protein structures, all of which are consistent with the observed list of experimental restraints. The structures in this ensemble will be very similar to each other in regions with strong restraints, and very different in less constrained portions of the chain. Presumably, these areas with fewer restraints are the flexible parts of the molecule, and thus do not give a strong signal in the experiment.
In the PDB archive, you will typically find two types of coordinate entries for NMR structures. The first includes the full ensemble from the structural determination, with each structure designated as a separate model. The second type of entry is a minimized average structure. These files attempt to capture the average properties of the molecule based on the different observations in the ensemble. You can also find a list of restraints that were determined by the NMR experiment. These include things like hydrogen bonds and disulfide linkages, distances between hydrogen atoms that are close to one another, and restraints on the local conformation and stereochemistry of the chain.
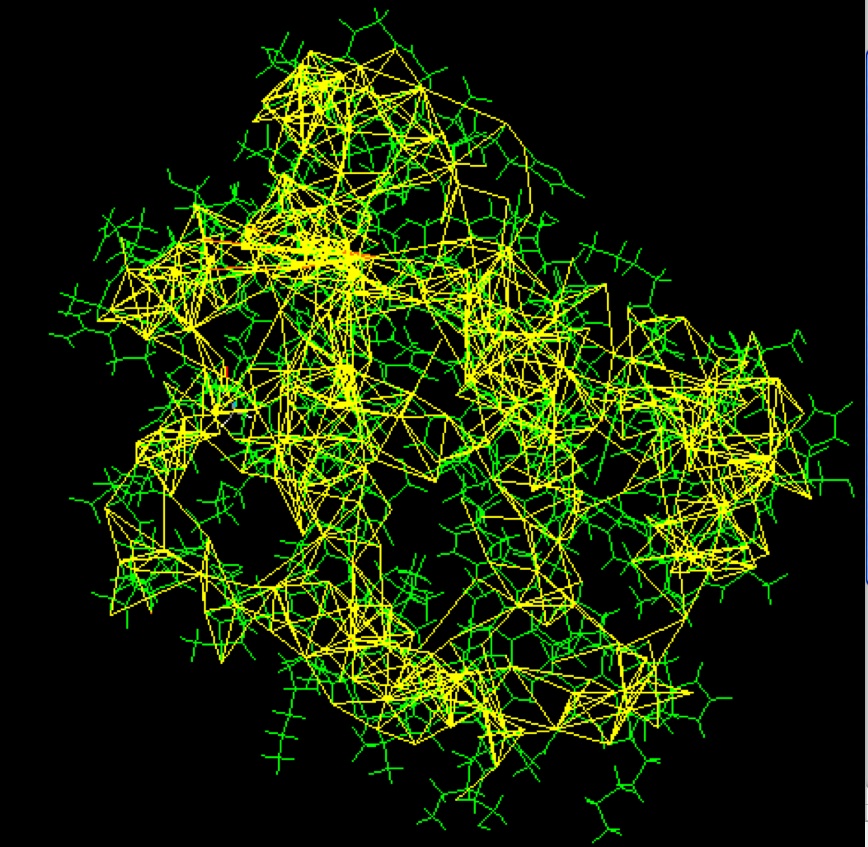
Some of the restraints used to solve the structure of a small monomeric hemoglobin are shown here, using software from the BioMagResBank1. The protein (1vre and 1vrf) is shown in green, and restraints are shown in yellow.
3D Electron Microscopy
Method Overview
Electron microscopy, frequently referred to as 3DEM, is also used to determine 3D structures of large macromolecular assemblies. A beam of electrons and a system of electron lenses is used to image the biomolecule directly. Several tricks are required to obtain a 3D structure from 2D projection images produced by transmission electron microscopes. The most commonly used technique today involves imaging of many thousands of different single particles preserved in a thin layer of non-crystalline ice (cryo-EM). Provided these views show the molecule in myriad different orientations, a computational approach akin to that used for computerized axial tomography or CAT scans in medicine will yield a 3D mass density map. With a sufficient number of single particles, the 3DEM maps can then be interpreted by fitting an atomic model of the macromolecule into the map, just as macromolecular crystallographers interpret their electron density maps. In a restricted number of cases, electron diffraction from 2D or 3D crystals or helical assemblies of biomolecules can be used determine 3D structures with an electron microscope using an approach very similar to that of X-ray crystallography. Finally, 3DEM techniques are gaining prominence in studying biological assemblies inside cryo-preserved cells and tissues using electron tomography. This method involves recording images at different tilt angles and averaging the images across multiple copies of the biological assembly in situ.
In terms of molecular and atomic detail, both single-particle 3DEM and electron diffraction methods are now yielding structures at resolution limits comparable to macromolecular crystallography (i.e., enabling visualization of amino acid sidechains, surface water molecules, and non-covalently bound ligands). Cryo-electron tomography provides structural information at slightly lower resolution (i.e., protein domains and secondary structural elements). In calendar 2016, PDB depositions of 3DEM structures exceeded those coming from NMR spectroscopy for the first time.
Recent dramatic advances in the power of 3DEM reflect the convergence of a number of technologies, including sample preparation/preservation in vitreous ice, improved electron optics, phase plates to enhance electron image contrast, direct electron detectors, improved data processing software, and faster computers. This fortuitous convergence parallels the acceleration of macromolecular crystallography that occurred in the 1990s, when crystal freezing, synchrotron radiation beamlines, image plate and CCD detectors, improved data processing software, and faster computers came together in an earlier perfect storm for structural biology.
In work focused on very large macromolecular assemblies, where lower resolution is the norm, 3DEM data are increasingly being combined with information from X-ray crystallography, NMR spectroscopy, mass spectrometry, chemical cross-linking, fluorescence resonance energy transfer, and various computational techniques to sort out the atomic details. This practice of fusing multiple experimental approaches is often referred to as Integrative or Hybrid Methods (I/HM). They have proven very useful for multimolecular structures such as complexes of ribosomes, tRNA and protein factors, and muscle actomyosin structures, as described below.
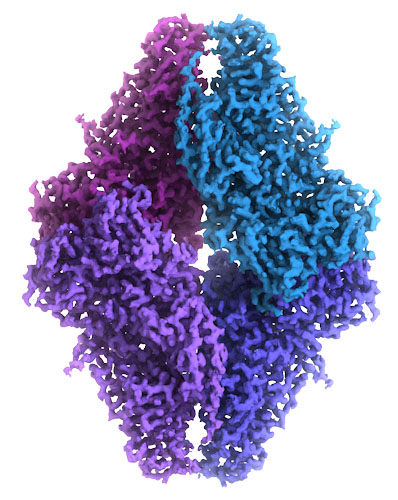
This cryo-EM map of beta-galactosidase was built from over 90,000 images of the molecule frozen in ice, which was detailed enough to provide an atomic model. The cryoEM map is at EMDataBank entry EMD-2984, and the atomic coordinates are in PDB entry 5a1a.
Image courtesy of Veronica Falconieri and Siriam Subramaniam, National Cancer Institute.
Integrative or Hybrid Modeling (IHM)
Researchers are interested in studying larger and more complex systems, and use every technique available to do so. The structural biology community has had particular success in recent years by using an approach, termed “integrative modeling.” The idea is to combine information from a variety of methods, each good for studying a particular aspect of the system, to create an overall picture of the assembly.
For instance, combining spectroscopic or chemical crosslinking data that identify distances between components in an assembly, with low resolution electron microscopy data that give information on the overall shape of a complex, has become an effective strategy in integrative modeling. In addition to traditional structural biology methods such as X-ray crystallography, NMR spectroscopy and electron microscopy, experimental methods such as small angle solution scattering, Forster resonance energy transfer, chemical crosslinking, mass spectrometry, electron paramagnetic resonance spectroscopy, and other biophysical techniques have been used in integrative modeling studies. A key aspect of integrative modeling is that the resulting structural models do not always comprise of atomic coordinates and can contain regions of coarse-grained beads that represent multiple atoms. This is due to the fact that different kinds of experiments provide information at different levels of resolution.
An example of integrative modeling is the structure of the nuclear pore complex (NPC) from budding yeast determined using data from chemical crosslinking, small angle solution scattering and electron microscopy experiments. The NPC is an eight-fold symmetric assembly consisting of 552 copies of 32 different proteins belonging to the nucleoporin family. The overall shape of the NPC is obtained from a low resolution electron microscopy map. Extensive data from chemical crosslinking experiments provide information regarding the proximities and orientations of the nucleoporins within the assembly. Small angle scattering profiles for some of the nucleoporins are available and structures of several component nucleoporins and their sub-complexes have been obtained using experimental methods and/or computational modeling. All available information are gathered and combined together using computational algorithms to build the integrative model of the entire complex.
IHM data became part of the PDB archive in 2024 and can be explored using RCSB.org tools.
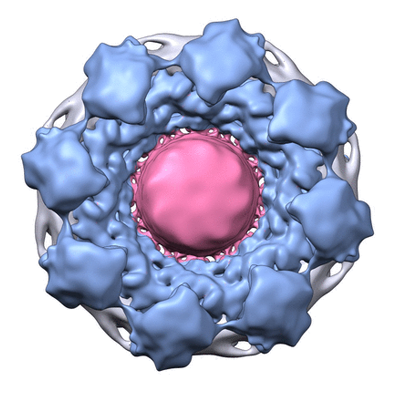
Cryo electron microscopy map of the NPC from EMD-7321
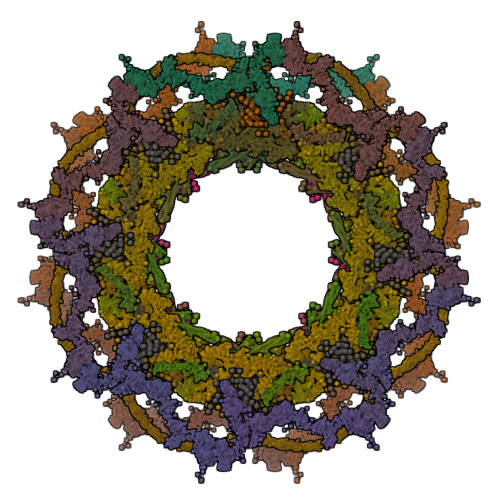
The integrative model of the NPC (PDB ID 8zzc) at RCSB.org.
Known structural models of nucleoporins: