PPAR-gamma
Peroxisome Proliferator-Activated Receptor Gamma (PPAR-γ) is a multi-domain nuclear transcription factor, normally residing in the cell cytoplasm. Upon binding to activating ligands (small molecules) it translocates to the nucleus, where it binds particular DNA segments and regulates gene expression. Genes activated by PPAR-γ have been linked to adipocyte or fat cell differentiation and lipid storage/release (Lehrke and Lazar, 2005). The PPAR-γ protein is the target of an important class of anti-diabetic medications known as thiazolidinediones (TZDs), like
Rosiglitazone and Pioglitazone
These drugs are insulin sensitizers – i.e., they promote insulin function in adipose tissue and skeletal muscles. TZDs mediate their effects through a cascade of protein-protein and protein-DNA interactions to regulate the activity of specific genes.
Overview of PPAR-γ Function
Peroxisome proliferator-activated receptors (PPARs) are ligand-dependent transcription factors that belong to the Type II nuclear receptor superfamily. This large protein family encompasses receptors for various hormones and ligands, including estrogen, thyroid hormone, retinoic-acid, and retinoid-X. While most of these receptors play major regulatory roles in metabolic function, energy homeostasis, and many other cellular processes, some have no known natural ligands and are referred to as "orphan" receptors. One such orphan receptor, PPAR-γ, is widely distributed in adipose tissue and skeletal muscle. Since abnormally low-level expression of this nuclear receptor leads to impaired insulin action, a hallmark of Type 2 Diabetes Mellitus (hereafter type 2 diabetes), PPAR-γ appears to play an important role in adipocyte differentiation, glucose metabolism, and anti-inflammatory pathways.
Human PPAR isotypes (PPAR-α, PPAR-γ, and PPAR-δ) are protein targets for drugs used to treat various cardio-metabolic diseases, including type 2 diabetes (Montanari et al., 2008). TZD binding to PPAR-γ alone cannot mediate its pharmacological response. Instead, PPAR-γ forms an obligate heterodimeric complex with retinoid X receptor-alpha (RXR-α). The heterodimer recognizes and binds to specific DNA sequences called PPAR response elements (PPREs), found in the promoter regions of various genes that encode proteins involved in regulating metabolism. Once bound to DNA, the PPAR-γ-RXR-α heterodimer may exist in either active or inactive states (Figure 1). In its inactive state (Figure 1a), this complex is associated with corepressors that interfere with gene activation (i.e., inhibit transcription). Small molecule ligands that stabilize the inactive conformation, are known as receptor antagonists. In the active state of the heterodimer (Figure 1b), agonist ligands bind to PPAR-γ [e.g., one of the TZDs] and RXR-α [9-cis retinoic acid (9RA)], triggering conformational changes in both proteins that weaken corepressor binding and potentiate recruitment of coactivators, which in turn activate transcription of lipid-metabolism and insulin-responsive genes.

|
| Figure 1. a) Inactive and b) Active states of the PPAR-γ-RXR-α-PPRE complex. Source: Adapted from (Wagner et al., 2010). |
The X-ray structure of the active state complex of PPAR-γ-RXR-α-PPRE is bound to both DNA and small segments of the co-activators (PDB ID 3dzy, Figure 2). Conserved coactivator LXXLL sequence motifs (where L=leucine; X= any amino acid), form α-helices that can interact with the conformationally active states (or shapes) of the nuclear receptors. Coactivator binding completes assembly of the active complex, which in turn triggers gene activation.

|
| Figure 2. X-ray structure of the active state complex of PPAR-γ–RXR-α-PPRE (PDB ID 3dzy; Chandra et al., 2008). Representation and color coding: PPAR-γ cylinders and arrows, red, pink, orange; RXR-α cylinders and arrows, blue, dark blue, cyan; RXR-α agonist ligand space-filling beige; PPAR-γ agonist ligand space-filling grey; Zn2+spheres black; Coactivators cylinder, green; and PPRE DNA ribbon and slabs, yellow. |
The following sections provide detailed descriptions of the key components of the active state complex and their mechanism of action:
- Receptor structure and function
- Human Peroxisome Proliferator-Activated Receptor-Gamma (PPAR-γ)
- Human Retinoid X Receptor-Alpha (RXR-α)
- Ligands
- PPAR-γ
- RXR-α
- Coactivators (SRC-1) and Corepressors (SMRT)
- DNA PPAR response elements (PPREs)
- Complex of PPAR-γ-RXR-α in the presence of their respective ligands, coactivators, and DNA target PPRE
Receptor Structure and Function
Like other members of the nuclear receptor superfamily, both PPAR-γ and RXR-α consist of four distinct functional domains or segments in the polypeptide chain (Figure 3):
- N-terminal A/B domain contains the ligand-independent activation function 1 (AF-1)
- C domain contains the DNA binding region (DBD)
- D domain or hinge region
- E/F domain at the C-terminus, includes both the ligand-binding domain (LBD) and ligand-dependent activation function domain 2 (AF-2)

|
| Figure 3. Linear schematic of PPAR-γ1 and RXR-α polypeptide chain segments. Source: Adapted from (Youssef and Mostafa, 2015). |
The A/B domains of both PPAR-γ and RXR-α are intrinsically flexible, do not exhibit high sequence conservation, and include potential sites of protein phosphorylation. These regions are known to bind other receptor domains and/or regulatory proteins (Chandra et al., 2008), and were excluded from the samples used for structure determination of the PPAR-γ:RXR-α:PPRE:Coactivator complex (PDB ID 3dzy). These A/B domains are not discussed any further.
Human Peroxisome Proliferator-Activated Receptor-Gamma (PPAR-γ)
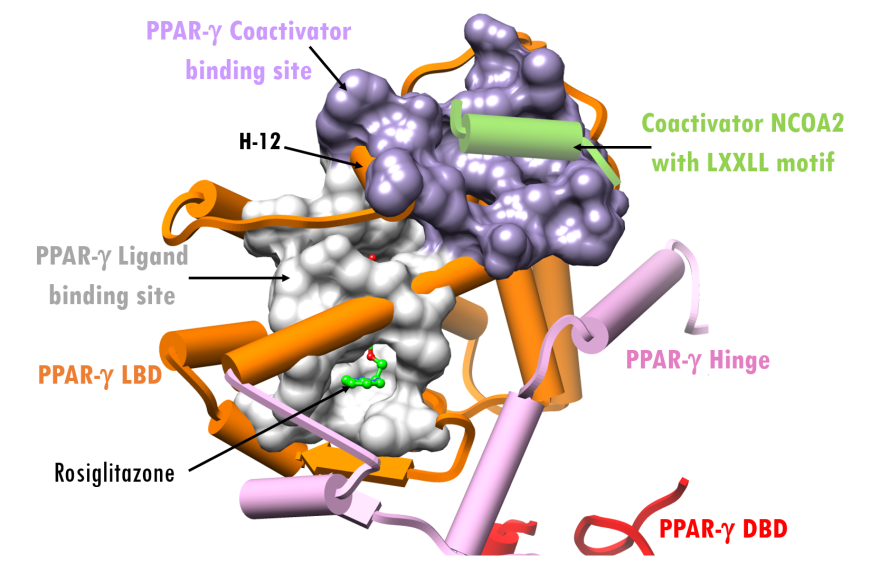
The human genome encodes four PPAR-γ isoforms (γ1, γ2, γ3, and γ4), each with minor sequence variations (Evans et al., 2004) and expressed in different tissues. Figure 4 illustrates a cut away view of the structure of PPAR-γ1 (hereafter PPAR-γ) in complex with agonist, a coactivator helix, and DNA (PDB ID 3dzy). This view was generated by rotating the structure shown in Figure 2 by 80° about the vertical axis, so that the LBD, hinge, and DBD domains can be clearly seen. In this view, the RXR-α, its interacting agonist, and second copy of the coactivator helix have been omitted for clarity.
The central, highly-conserved DNA-binding domain (DBD), shown as red cylinders and two zinc ions, binds to one half of the PPRE (grey in Figure 4). The ligand-binding domain (LBD) of PPAR-γ, shown as orange cylinders, mediates ligand-binding, receptor dimerization, and interacts with other components of the transcription machinery (Nielsen et al., 2006). Like the DBD, the LBD is highly conserved across PPAR receptor isoforms. The hinge region, shown in pink, physically connects the DBD and the LDB and positions the two functionally distinct domains close to one another. The ligand-dependent activation domain, AF-2, is located at the C-terminus of the LBD. This is the region where the coactivators and corepressors bind (near α-helices H-2, H-3 and H-12 in Figure 4).

|
| Figure 4. X-ray structure of the active state complex of PPAR-γ–RXR-α-PPRE (PDB ID 3dzy; Chandra et al., 2008), showing only PPAR-γ bound to coactivator NCOA2 and PPRE DNA. (RXR-α and its ligand were omitted for clarity.) Representation and color coding: PPAR-γ cylinders and arrows, DNA binding domain (DBD) red; hinge pink; ligand binding domain (LBD) orange; PPAR-γ agonist ligand space-filling grey; Zn2+spheres black; coactivator cylinder, green. PPRE DNA ribbon and slab grey. |
The ligand and regulator (coactivator/corepressor) binding surfaces of PPAR-γ are highlighted in Figure 5. α-Helix H-12 serves as a ligand-regulated switch for nuclear receptor transcriptional activity (Figures 4 and 5). In active conformation of the complex (i.e., with bound agonist), the PPAR-γ H-12 facilitates coactivator binding. In the inactive state, this same H-12 changes its conformation, which enables corepressor binding instead (not shown here).
Human Retinoid X Receptor-Alpha (RXR-α)
The biological functions of the RXRs are not fully understood - i.e., it is not clear if they independently mediate a signaling pathway or only serve as partners for other nuclear receptors, (Szanto et al., 2004). Found predominantly in liver, RXR family members form heterodimers with various nuclear receptors and play important regulatory roles in metabolic signaling pathways (e.g., glucose, fatty acid) and several metabolic disorders, including type 2 diabetes, hyperlipidemia, and atherosclerosis (Ahuja et al., 2003). RXR is unique in its ability to form both homo- and heterodimers, but it is thought to have a greater propensity for heterodimerization (e.g., with peroxisome proliferator-activated receptors) versus homodimerization.
Like the PPARs, the RXRs consist of multiple isoforms (α, β, and γ). All isoforms are activated by the endogenous ligand 9-cis retinoic acid. As seen for all nuclear receptors, overall structure of RXR-α consist of four distinct functional domains (A/B, C, D, E/F; Figure 3). Figure 6 illustrates the structure of RXR-α plus agonist, a bound coactivator, and DNA (PDB ID 3dzy). This view was generated by rotating the structure shown in Figure 2 by120° about the vertical. In this view, PPAR-γ, its agonist, and a bound coactivator were omitted for clarity. The central, highly-conserved DNA-binding domain (DBD), shown as light blue cylinders and two zinc ions, bind to one half of the PPRE (grey in Figure 6). The hinge region is shown in dark blue. The RXR-α hinge region appears to be more flexible than the corresponding region in PPAR-γ. Higher apparent hinge flexibility may allow the RXR-α LBD and DBD to adopt a wide range of orientation, which would be consistent with its role as a promiscuous partner in nuclear receptor complexes. Unlike PPAR-γ, the LBD and the DBD of RXR-α are spatially distant from one another.

|
| Figure 6. X-ray structure of the active state complex of PPAR-γ–RXR-α-PPRE (PDB ID 3dzy; Chandra et al., 2008), showing only RXR-α bound to coactivator NCOA2 and PPRE DNA. (PPAR-γ and its ligand were omitted for clarity.) Representation and color coding: RXR-α cylinders and arrows, DNA binding domain (DBD) blue; hinge dark blue; ligand binding domain (LBD) cyan; RXR-α ligand space-filling beige; Zn2+spheres black; coactivator pipe green. PPRE DNA ribbons and slab grey. |
The ligand and regulator (coactivator/corepressor) binding surfaces in RXR-α are shown in Figure 7. The ligand-dependent activation domain, AF-2 is located at the C-terminus of the LBD. This region supports binding of coactivators and corepressors (near α-helices H-2, H-3 and H-12, as show in Figure 6). The AF-2 domain contains α-helix H-12, which acts as a ligand-regulated switch for nuclear receptor transcriptional activity (Figures 6 and 7). In the active conformation of the complex (i.e., with bound agonist), α-helix H-12 of RXR-α is positioned to facilitate binding of coactivators. In the inactive state, α-helix H-12 shifts to a different conformation, which enables corepressor binding instead.

|
| Figure 7. X-ray structure of the active state complex of PPAR-γ–RXR-α-PPRE depicting the ligand and coactivator binding sites on RXR-α (PDB ID 3dzy, Chandra et al., 2008). ( PPAR-γ and its ligand were omitted for clarity.) Representation and color coding: RXR-α cylinders and arrows, DNA binding domain (DBD) blue; hinge dark blue; ligand binding domain (LBD) cyan; RXR-α ligand, 9-cis Retinoic Acid, in ball-and-stick beige/red; coactivator pipe green; ligand binding site surface silver; coactivator binding site surface purple. |
Ligands of PPAR-γ
The natural ligand of PPAR-γ is not yet known, but this receptor can bind various lipophilic ligands, including polyunsaturated fatty acids and a wide range of small man-made synthetic organic compounds that modulate PPAR-γ dependent gene expression (Berger and Moller, 2002). Some natural ligands of PPAR-γ include polyunsaturated fatty acids (e.g., eicosapentaenoic acid), fatty acid derivatives, and prostaglandin PGJ2 (a group of physiologically active lipid compounds involved in anti-inflammation and recovery from infection). Although PPAR-γ can be activated by polyunsaturated and oxidized fatty acids, these compounds bind to the receptor with low affinity and are not thought to be biologically-relevant. Synthetic compounds, such as fibrates and TZDs (both PPAR-γ agonists) are used to treat dyslipidemia and diabetes mellitus, respectively (Grygiel-Górniak, 2014). Structures of two anti-diabetic drugs from the TZD class, rosiglitazone and pioglitazone, are illustrated in Figure 8.

|
| Figure 8. Chemical structures of rosiglitazone: a) 2D drawing, b) 3D Ball-and-stick figure; and pioglitazone c) 2D drawing, d) 3D Ball-and-stick figure. Atom color coding: C-black/grey, N-blue, O-red, S-yellow. |
Ligands of RXR-α
A natural ligand of RXR-α is 9-cis retinoic acid (Figure 9). Additional small molecules, including polyunsaturated fatty acids, docosahexaenoic acid (DHA), and a saturated metabolite of chlorophyll, phytanic acid, have also been identified as natural ligands of RXR-α (Dawson, et al., 2012).

|
| Figure 9. Chemical structures of 9-cis Retinoic Acid a) 2D drawing, b) 3D Ball-and-stick figure. Atom color coding: C-black/grey, O-red. |
Coactivators (SRC-1) and Corepressors (NCoR)
Table 1 lists several nuclear coactivator and corepressor motif sequences. The coactivator motif that binds to nuclear receptors is LXXLL, whereas the corepressor motif is LXX(I/H)IXXX(L/I) [where X = any amino acid, L = Leucine, I = Isoleucine, and H = Histidine].
Table 1: Selected coactivator and corepressor sequence motifs (Xu et al., 2002).

Coactivators of PPAR-γ enhance transcription activation either by remodeling chromatin structure or stabilizing higher-order transcription factor complexes. The coactivator binds in the hydrophobic cleft formed by α-helices H-2, H-3 and H-12 of the LBD. Figure 10 illustrates the interactions of a coactivator with PPAR-γ (a) and RXR-α (b) as observed in the 3D structure (PDB ID 3dzy). In both cases, the conserved leucine sidechains of the LXXLL motif interact with the LBDs, predominantly involving the H-12 α-helices of both PPAR-γ and RXR-α.

|
| Figure 10. X-ray structure of the active state complex of PPAR-γ–RXR-α-PPRE (PDB ID 3dzy) with bound agonists and coactivators a)PPAR-γ and b) RXR-α. Representation and color coding: PPAR-γ LBD cylinders, orange; RXR-α LBD cylinders, cyan; coactivators cylinder, green, with stick figures for conserved leucine residues. |
Co-repressors bind to the inactive conformational states of nuclear receptors, either in the absence of ligands or when the inactive conformation is stabilized by an antagonist. Corepressor binding down regulates gene expression by recruiting histone deacetylases (HDACs), a class of enzymes that remove acetyl groups from tails of histone proteins bound to the promoter regions of target genes. Removal of the acetyl groups from histone protein tails stabilizes a tighter, repressive chromatin structure that reduces transcription factor binding to the promoter and transcriptional activation.
The structure of RXR-α with bound corepressor SMRT2 (PDB ID 3r29, Figure 11a) reveals how the conserved leucine residues of the corepressor motif interact with α-helices of the RXR-α LBD. The corepressor motif in this structure occurs as a 3-turn α-helix, versus a 2-turn α-helix in the case of coactivators. An overlay of the RXR-α structures bound to corepressor (PDB ID 3r29 in grey/purple) and coactivator (PDB ID 3dzy in blue/green) (Figure 11b) illustrates structural differences between active and inactive conformations of the RXR-αreceptor LBD. The corepressor α-helix (purple) binds to the site that α-helix H-12 occupies in the coactivator bound complex.

|
| Figure 11. a) X-ray structure of RXR-α with corepressor, SMRT peptide (PDB ID 3r29; Zhang et al., 2011). Representation and color coding: RXR-α LBD ribbon grey; corepressor ribbon purple with thick stick figures for conserved Leucine residues. b) Overlay of RXR-α corepressor (PDB ID 3r29) and RXR-α coactivators (PDB ID 3dzy) structures. Representation and color coding: inactive state RXR-α LBD ribbon grey; corepressor ribbon purple; active state RXR-α LBD cylinders, cyan; coactivator cylinder, green. |
PPAR response elements (PPREs)
The PPAR response elements (PPREs), are located near promoter regions of insulin-responsive target genes. PPREs consist of two DNA segments with sequence 5’-AGGTCA-3’, arranged in a Direct Repeat configuration with an intervening one base-pair spacer (referred to as “DR1”) (Figure 12). The consensus DNA sequence for PPAR-γ/RXR-α binding is, therefore, 5’-AGGTCANAGGTCA-3’ (N denoting any one of the four nucleotide bases). The two repeated 5’-AGGTCA-3’ sequences are typically referred to as half-sites.

|
| Figure 12. X-ray structure of the PPRE DNA half-site direct repeats in the PPAR-γ-RXR-α-PPRE structure (PDB ID 3dzy; Chandra et al., 2008). Representation and color coding: PPRE DNAdouble helix ribbon and slab (yellow); 5’-AGGTCA-3’ half-site direct repeats (grey); single base pair spacer (magenta). |
The DBDs of PPAR-γ and RXR-α each bind to one half-site (Figure 13, PDB ID 3dzy). α-Helices in both receptor DBDs bind to sequence-specific features within the major groove of the 5’-AGGTCA-3’ half sites via hydrogen bonding. The PPAR-γ DBD typically makes more contacts with DNA than RXR-α.

|
| Figure 13. X-ray structure of the active state complexofPPAR-γ-RXR-α-PPRE depicting the interactions of PPAR-γ and RXR-αDBDs with the PPRE DNA elements (PDB ID 3dzy; Chandra et al., 2008). Representation and color coding: PPAR-γ DBD cylinders, red; RXR-α DBD cylinders and arrows, blue; Zn2+spheres black; PPRE DNA double helix ribbon and slab (yellow); 5’-AGGTCA-3’ half-site direct repeats (grey); single base pair spacer (magenta). |
PPAR-γ-RXR-α, Agonists, Coactivator, PPRE Complex
The 3D structure of PPAR-γ:RXR-α complex recognizing a PPRE, in the presence of coactivators and agonist ligands (PDB ID 3dzy, Figure 14) revealed that the receptors bind to each other through two major intermolecular interfaces - involving both LBDs and both DBDs, respectively. The hinge region of RXR-α adopts a random coil plus α-helix conformation and is thought to be relatively flexible. The LBD and DBD domains of RXR-α are spatially separate, whereas the same domains in PPAR-γ are closer together as a result of interactions with the PPAR-γ hinge region. Both receptor ligands occupy hydrophobic pockets in the interior of the LBDs. The AF-2 domain in the LBD contains α-helix H-12, which acts as a ligand-regulated switch for agonist/antagonist mediated transcriptional modulation. The structures of PPAR-γ:RXR-α bound to coactivators (PDB ID 3dzy) versus RXR-α bound to corepressors (PDB ID 3r29) highlight the importance of the AF-2 α-helix H-12 in regulating function. In the “ON” state of the complex, α-helix H-12 is stabilized in the active conformation by receptor agonist ligands. In the “OFF” state, α-helix H-12 adopts an alternative inactive conformation and with the corepressor occupying the position vacated by movement of α-helix H-12.

|
| Figure 14. X-ray structure of PPAR-γ–RXR-α complex plus agonist ligands and coactivators bound to a PPRE (PDB ID 3dzy; Chandra et al., 2008). Representation and color coding: PPAR-γ cylinders and arrows, red, pink, orange; RXR-cylinders and arrows, blue, dark blue, cyan; RXR-α ligand space-filling beige; PPAR-γ ligand space-filling grey; Zn2+spheres black; coactivators cylinder, green. PPRE DNA ribbons and slabs, yellow. |
Pharmacologic Implications
Many drugs used in the treatment of type 2 diabetes seek to reduce hyperglycemia (e.g., biguanides and sulfonylureas), but do not potentiate insulin action. The biguanides lower blood glucose levels by suppressing hepatic glucose production; whereas, the sulfonylureas function by increasing insulin secretion from functional pancreatic β-cells. The thiazolidinediones (TZDs) were the first class of US FDA-approved insulin sensitizing anti-diabetes drugs. As discussed above, they bind to and then activate PPAR-γ as part of the PPAR-γ/RXR-α heterodimer, thereby promoting expression of insulin-responsive genes implicated in glucose metabolism to enhance skeletal muscle and adipose tissue sensitivity to insulin (Cawthorn and Seth, 2007).
References
Ahuja, H.S., Szanto, A., Nagy, L., and Davies, P.J. (2003). The Retinoid X Receptor and its Ligands: Versatile Regulators of Metabolic Function, Cell Differentiation and Cell Death. Journal of Biological Regulators and Homeostatic Agents, 17, 29-45. PMID: 12757020
Berger, J. and Moller, D.E. (2002). The Mechanisms of Action of PPARs. Annual Review of Medicine,53, 409-435. https://doi.org/10.1146/annurev.med.53.082901.104018
Cawthorn, W.P. and Seth, J.K. (2008). TNF-α and Adipocyte Biology. FEBS Letters, 582, 117-131. https://doi.org/10.1016/j.febslet.2007.11.051
Chandra, V., Huang, P., Hamuro, Y., Raghuram, S., Wang, Y., Burris, T.P., and Rastinejad, F. (2008). Structure of the intact PPAR-γ–RXR-α nuclear receptor complex on DNA. Nature, 495, 350-356. https://doi.org/10.1038/nature07413
Dawson, M.I., and Zebin, X. (2012). The Retinoid X Receptors and Their Ligands. Biochimica Biophysica Acta, 1821, 21-56. https://doi.org/10.1016/j.bbalip.2011.09.014
Evans, R.M., Barish, G.D., and Wang, Y.X. (2008). PPARs and the complex journey to obesity. Nature Medicine, 10(4), 355-361. https://doi.org/10.1038/nm1025
Grygiel-Górniak, B. (2014). Peroxisome Proliferator-Activated Receptors and Their Ligands: Nutritional and Clinical Implications - A Review. Nutrition Journal, 13, 1-10. https://doi.org/10.1186/1475-2891-13-17
Lehrke, M., and Lazar, M.A. (2005). The Many Faces of PPARγ. Cell, 123, 993–999. https://doi.org/10.1016/j.cell.2005.11.026
Montanari, R., Saccoccia, F., Scotti, E., Crestani, M., Godio, C., Gilardi, F., Loiodice, F., Fracchiolla, G., Laghezza, A., Tortorella, P., Lavecchia, A., Novellino, E., Mazza, F., Aschi, M., and Pochetti, G. (2008) Crystal Structure of the Peroxisome Proliferator-Activated Receptor γ (PPARγ) Ligand Binding Domain Complexed with a Novel Partial Agonist: A New Region of the Hydrophobic Pocket Could Be Exploited for Drug Design. Journal of Medicinal Chemistry, 51, 7768-7776. https://doi.org/10.1021/jm800733h
Nielsen, R., Grøntved, L., Stunnenberg, H.G., and Mandrup, S. (2006). Peroxisome Proliferator-Activated Receptor Subtype- and Cell-Type-Specific Activation of Genomic Target Genes upon Adenoviral Transgene Delivery. Molecular and Cellular Biology, 26, 5698-5714. https://doi.org/10.1128/MCB.02266-05
Szanto, A., Narkar, V., Shen, Q., Uray, I.P., Davies, P.J., and Nagy, L. (2004). Retinoid X Receptors: X-Ploring their (Patho)Physiological Functions. Cell Death Differentiation, 11, S126-S143. https://doi.org/10.1038/sj.cdd.4401533
Wagner, E.R. He, B.C., Chen, L., Zuo, G.W., Zhang, W., Shi, Q., Luo, Q., Luo, X., Liu, B., Luo, J., Rastegar, F., He, C.J., Hu, Y., Boody, B., Luu, H.H., He, T.C., Deng, Z.L., and Haydon, R.C. (2010). Therapeutic Implications of PPARgamma in Human Osteosarcoma. PPAR Research, 1-16. http://dx.doi.org/10.1155/2010/956427
Xu, H.E., Stanley, T.B., Montana, V.G., Lambert, M.H., Shearer, B.G., Cobb, J.E., McKee, D.D., Galardi, C.M., Plunket, K.D., Nolte, R.T., Parks, D.J., Moore, J.T., Kliewer, S.A., Willson, T.M., Stimmel, J.B. (2002). Structural basis for antagonist-mediated recruitment of nuclear co-repressors by PPARalpha. Nature 415, 813-817. https://doi.org/10.1038/415813a
Youssef, J., and Badr, M. (2015). Peroxisome Proliferator-Activated Receptors Features, Functions, and Future. Nuclear Receptor Research, 2, 1-30. https://doi.org/10.11131/2015/101188
Zhang, H., Chen, L., Chen, J., Jiang, H., and Shen, X. (2011). Structural Basis for Retinoic X Receptor Repression on the Tetramer. Journal of Biological Chemistry, 286, 24593-24598. https://doi.org/10.1074/jbc.M111.245498
June 2018, Jennifer Jiang, Dr. Sutapa Ghosh ; Reviewed by Drs. David K. Clawson and Stephen K. Burley
http://dx.doi.org/10.2210/rcsb_pdb/GH/DM/drugs/TZD/ppar-gamma