Molecular Landscapes by David S. Goodsell
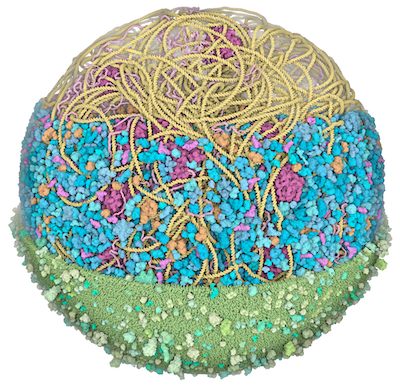
Model of a Mycoplasma Cell, 2021
Acknowledgement: Martina Maritan, Ludovic Autin, David S. Goodsell, Scripps Research and RCSB Protein Data Bank. doi: 10.2210/rcsb_pdb/goodsell-gallery-040
This image shows a 3D model of an entire Mycoplasma genitalium cell. This snapshot represents a Mycoplasma cell at the beginning of its life cycle. Cell shape has been approximated to a sphere with a radius of ~145nm. Each protein is represented by a 3D structure coming from either homology modeling, a previous model of mycoplasma cytoplasm, experimental data, or homologs from the Protein Data Bank. The nucleoid structure was modeled with LatticeNucleoid. Small molecules, ions, and water are not shown in the illustration, and would fill the spaces between the macromolecules.
In the image, two clipping planes progressively hide parts of the model. The upper section highlights ribosomes (magenta), DNA (yellow) and mRNA (pink) filaments; the central section shows the bacterial nucleoid in the context of soluble macromolecules (DNA-binding proteins in orange, cytoplasmic proteins in shades of blue, tRNAs in bright pink); the lower section shows the cell membrane (grey/green) with associated membrane proteins (shades of green).
Detailed descriptions of the data curation, model building, and visualization methods can be found in the Journal of Molecular Graphics article: ‘Building Structural Models of a Whole Mycoplasma Cell’, https://doi.org/10.1016/j.jmb.2021.167351. Additional images of this model are available at the Center for Computational Structural Biology at Scripps Research.


